Are you getting enough productivity? Is your development process slow and taking time? Are you unaware of what exactly is taking so much time? Are you unable to deliver quality and developers are frustrated?
If the answer to any of these questions is yes, there are chances that you are not using the Agile methodologies effectively. Agile is a methodology for the development teams to defeat all challenges and deliver top-notch applications. Regularly reviewing and adapting the processes based on feedback and data is key to Agile’s iterative and improvement-focused approach. It focuses on delivering value incrementally aligning perfectly with the pursuit of productivity, streamlining time management, enhancing quality, and more.
When you plan to start an Agile project, planning for measuring success in a project is a fundamental aspect of ensuring that the project is on track and delivering value. Metrics are the measurable indicators that offer the effectiveness of Agile processes. It allows agile teams to monitor productivity, shed light on bottlenecks, take necessary action, and plan to continuously improve the development cycle. Let us explore all these metrics.
Agile Metrics for More Progress and Effectiveness
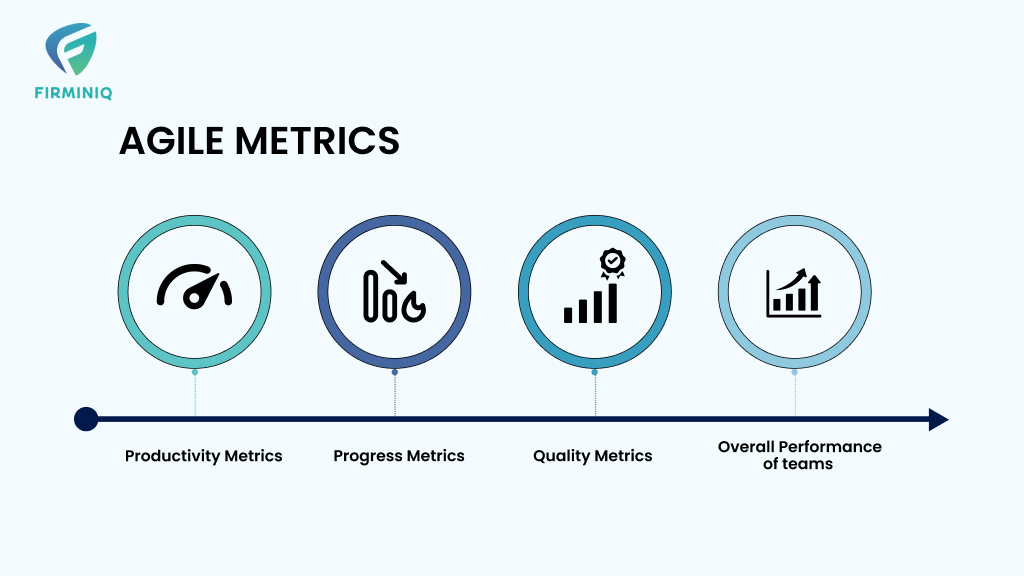
Every project is unique, and the metrics that provide valuable insights can vary based on the project’s goals. To enhance the Agile process overall, it is vital to define what elements are valuable and relevant for your specific project. Carefully selecting the metrics sets a foundation for meaningful data collection and helps with improved decision-making. On a prominent level, we can divide the key metrics into 4 broad categories. Let us understand all the metrics.
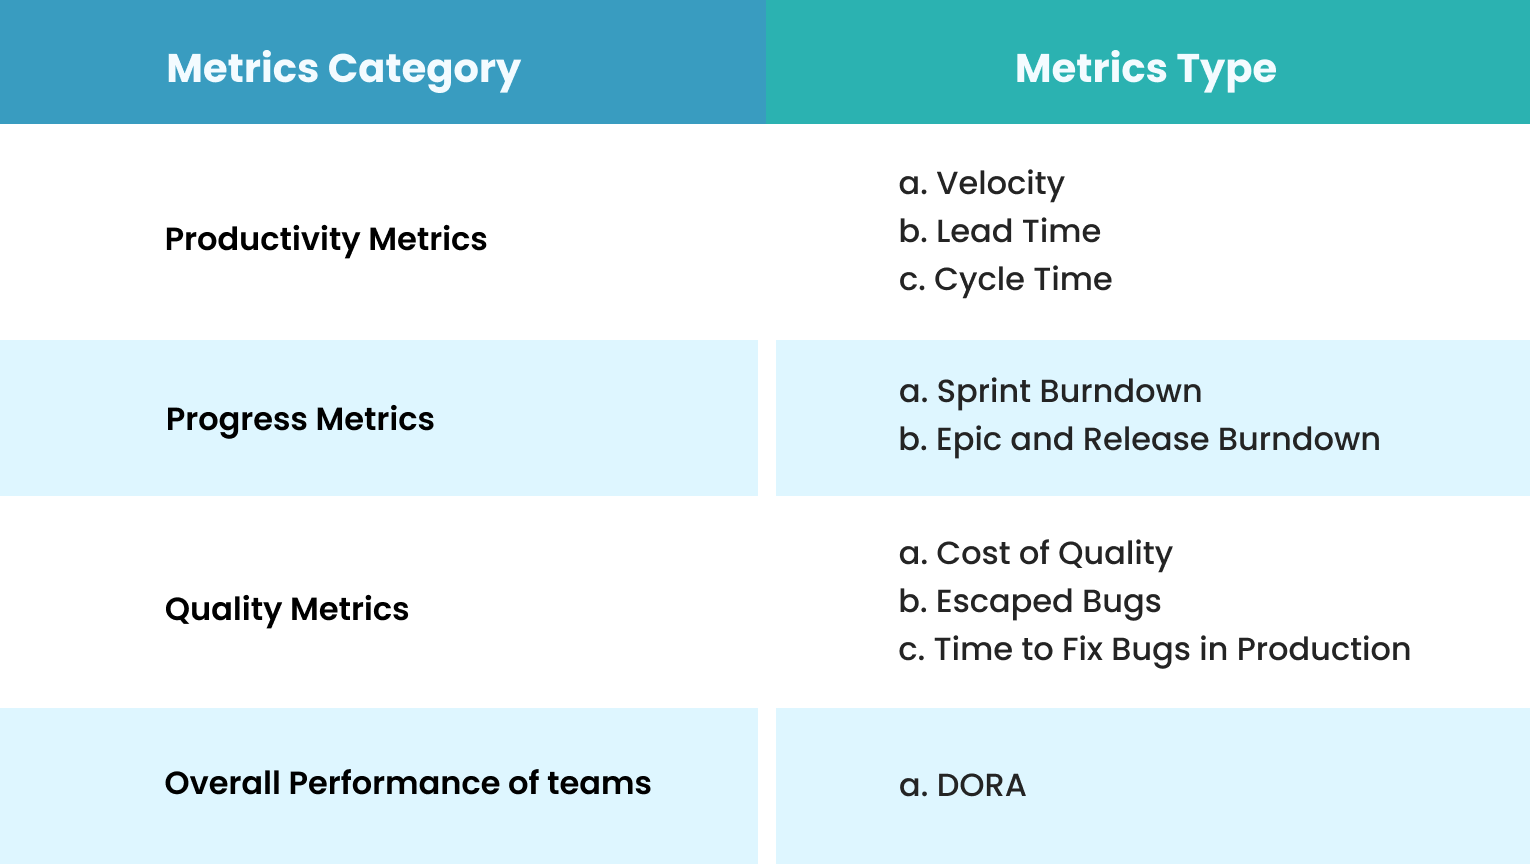
1. Productivity Metrics
Productivity metrics offer insights into the efficiency and output of the development team. These metrics help you assess how effectively your team is delivering value and achieving project goals. It can be categorized into following parts:
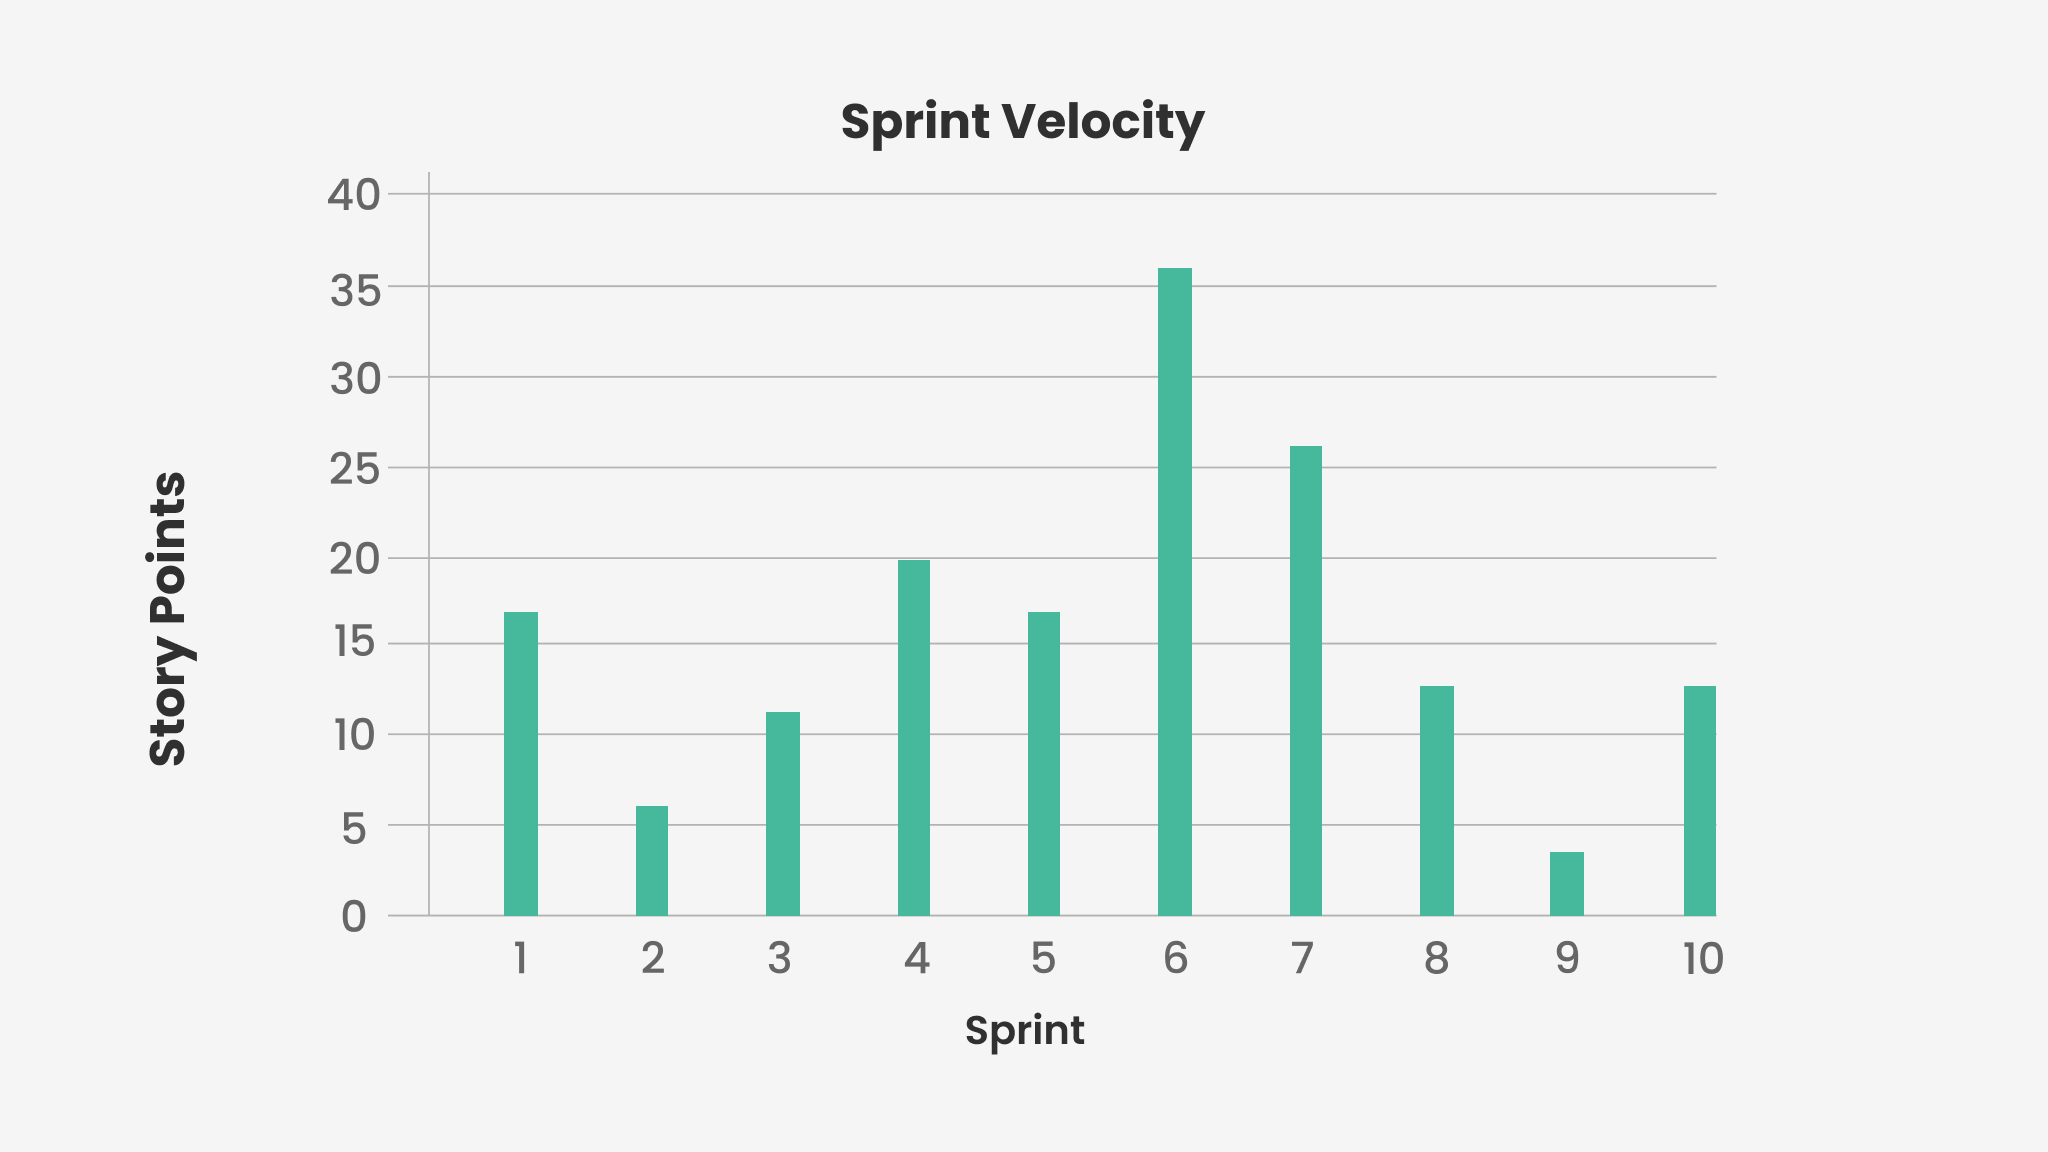
a. Velocity
It refers to the average amount of work completed by a team within an iteration (sprint). The velocity can either be measured in story points or hours. There are many iterations involved in getting story points right for the team and the accuracy of the forecast depends on the number of iterations as teams learn.
If a product owner wishes to complete 300 story points in backlogs, the developers can cover 50 story points per iteration. It means there will be 6 iterations needed to complete the task.
What to Look for When Aiming to Accurately Measure Velocity?
Ensure that velocity is correctly measured considering vacations, holidays, and overall size of the team. Considering upcoming holidays and planned vacations when estimating the team’s capacity for work during a sprint or iteration helps in optimizing the velocity. Adjust the team’s availability by factoring in the number of working days available.
Velocity drops often signal that something within the development process is not functioning optimally. Closely monitoring velocity fluctuations and addressing the underlying reasons maintains a stable and predictable project trajectory. It helps ensure that the team delivers consistent value. The potential reasons for the fluctuations could be bottlenecks, dependencies, and other factors hindering the team’s efficiency.
b. Lead Time
Lead time refers to the total time it takes for a feature to enter the system or to go from the point of being requested to the point of completion and deployment. The metrics comprise all the steps, processes, and other activities that are involved during the release.
Combining lead time and cycle time metrics can provide valuable insights into the inefficiencies of separate phases within your development process, including requirements gathering, UX design, and development.
What to look for When Aiming to Accurately Measure Lead Time?
Closely examining lead time and drilling down into its components, you can uncover the root causes of delays, time we spent on requirements vs development time. It helps us to implement necessary improvements and create a more efficient and streamlined Agile workflow that delivers value to stakeholders in a timely manner.
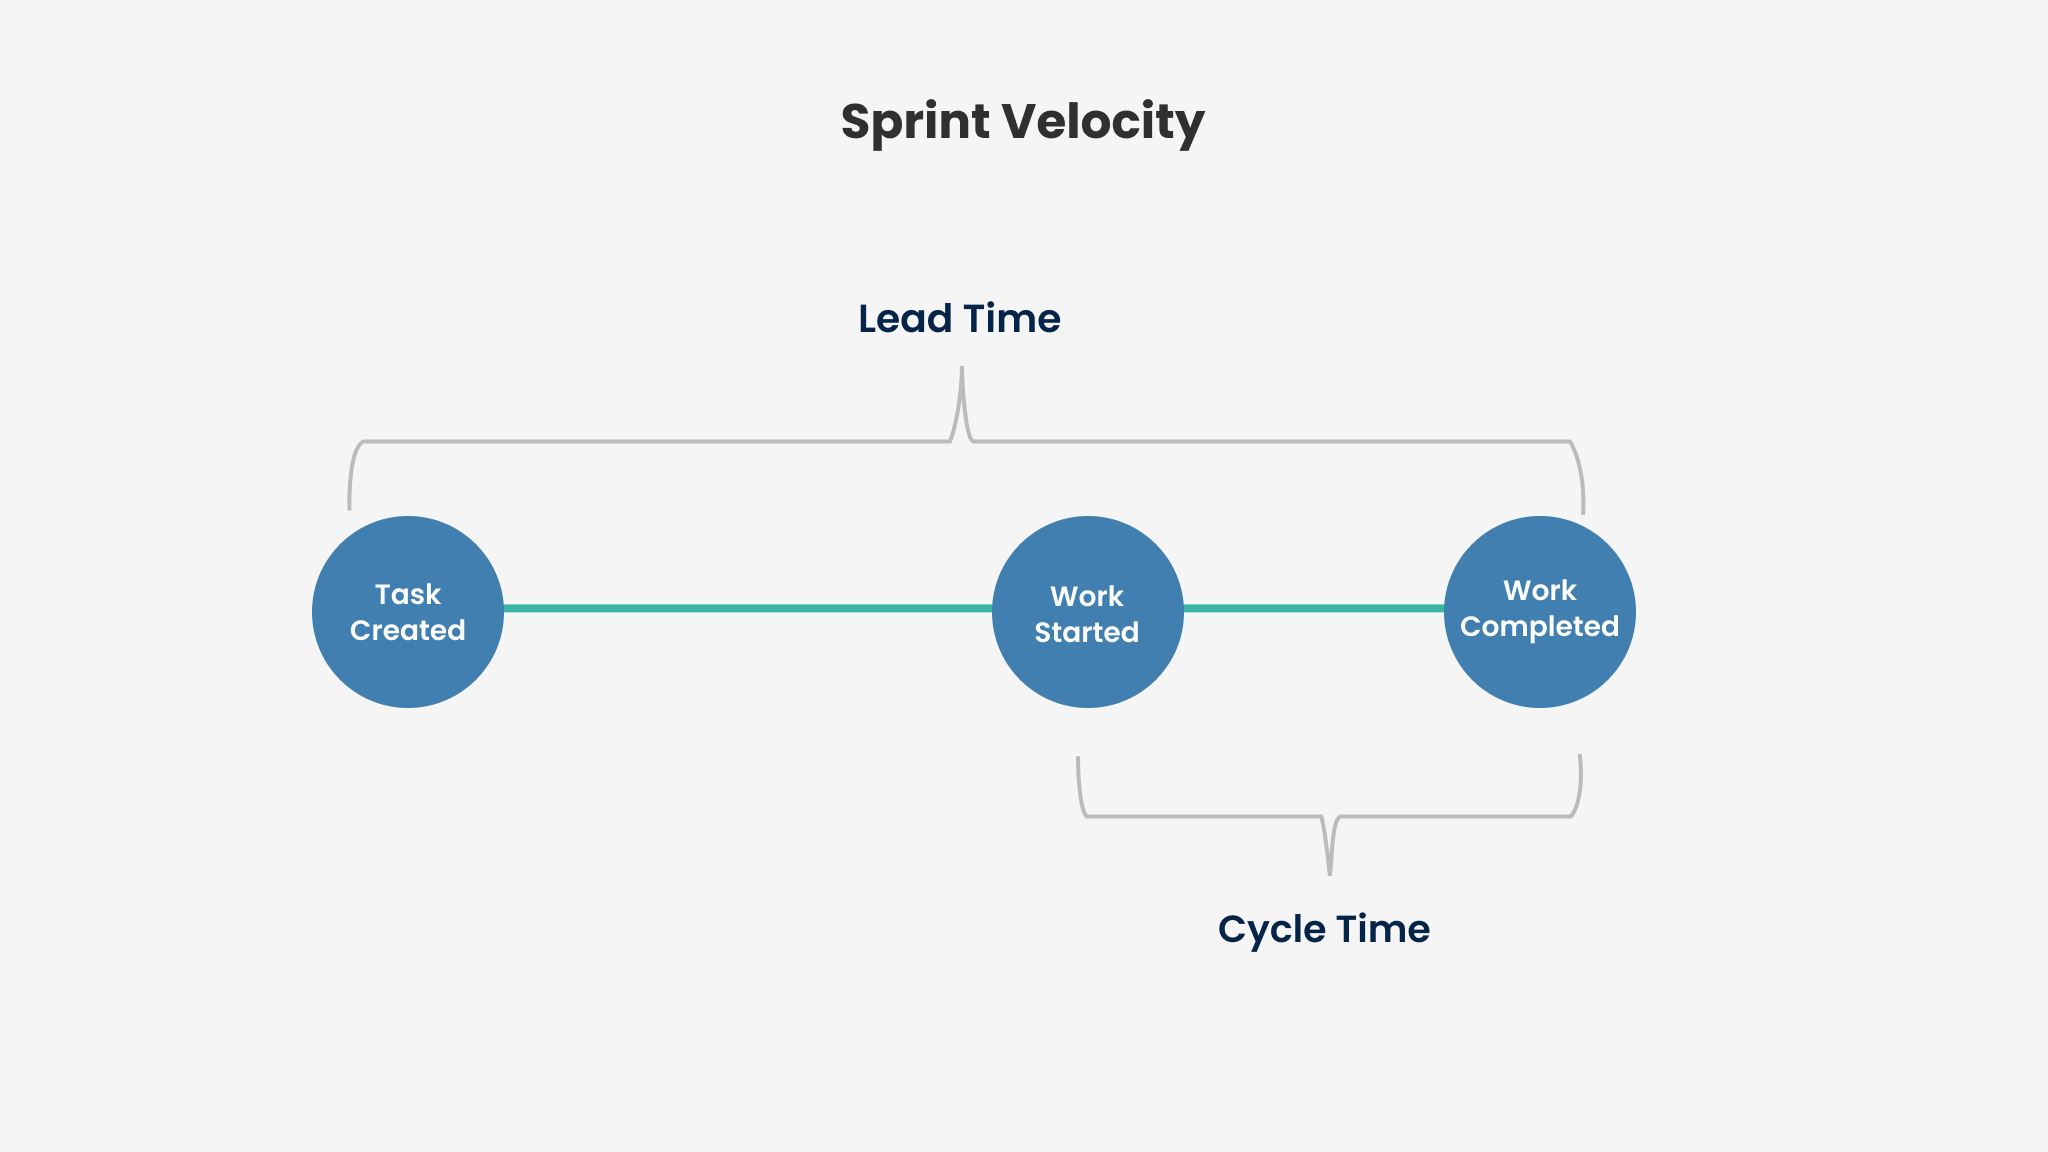
c. Cycle Time
It is a subset of lead time and focuses specifically on the time it spends being actively worked on. It starts to accumulate once the developers start to work on the request.
Cycle time should show and provide metrics for all the steps involved in moving the story from in- to the done state. It helps to answer and help the team challenge each step in the process, and why it exists. What purpose does it serve? And does it contribute directly to value delivery or quality?
What to look for When Aiming to Measure Cycle Time?
Continuously focusing on improving cycle time, evaluating steps (e.g., is my review time more than my coding time, how long stories are we waiting for third parties, external teams etc.), and implementing improvements enhance the efficiency of your Agile processes. It helps to deliver value, capitalize on automation opportunities, and create a more responsive development environment.
2. Progress Metric
Progress metric measures the advancement of work within a project, providing insight into how much work has been completed and how much remains. It can be categorized into following parts:
a. Sprint Burndown
Agile teams using Scrum based methodology work in time-bound iterations called sprints, which are short periods during which they plan, develop, test, and deliver a set of features or user stories. With the sprint burndown chart, the team and stakeholders can monitor the completion of work and understand whether they are on track to achieve their sprint goals or not. They can have a streamlined understanding of the remaining work on the vertical Y axis and time on the horizontal X axis.
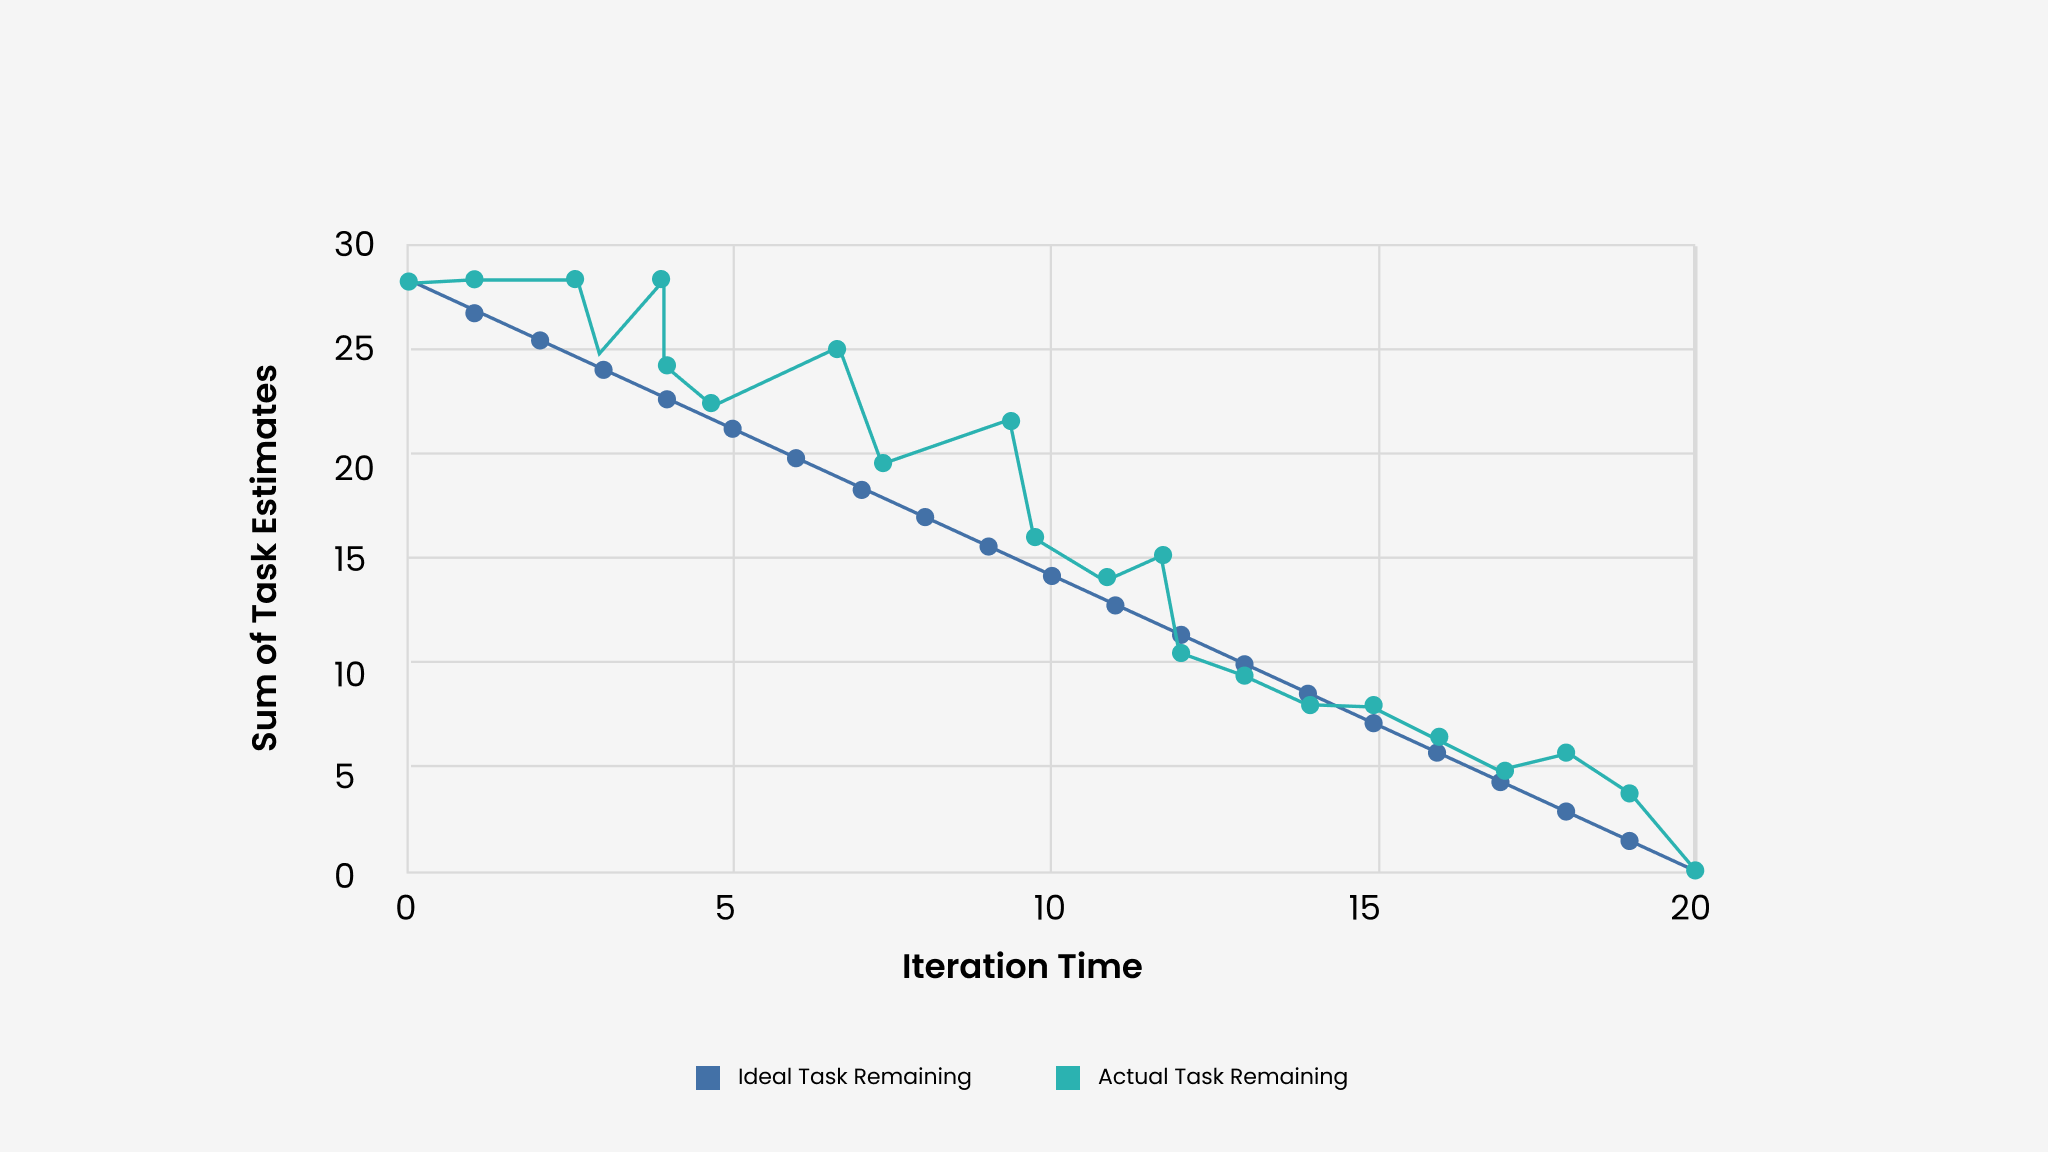
What to look for When Aiming to Measure Sprint Burndown?
Observing the sprint burndown chart’s trajectory is crucial for Agile teams. A smooth, consistent downward trend signifies well-paced progress, while a sudden drop nearing the release can indicate potential issues such as stories are merged in bulk in the end, developers are accumulating work. This may lead to potential quality issues.
b. Epic and Release Burndown
Epic and Release Burndown charts are valuable tools in Agile project management for tracking and comparing planned work (scope) against actual progress over time. It tracks the progress of completion of epics over time and usually covers larger bodies. It usually covers large stories of features that cannot be completed within a single sprint. It guides development for both the Kanban and Scrum team. As there are different epics involved in a sprint, tracking progress of each sprint and epic version is important.
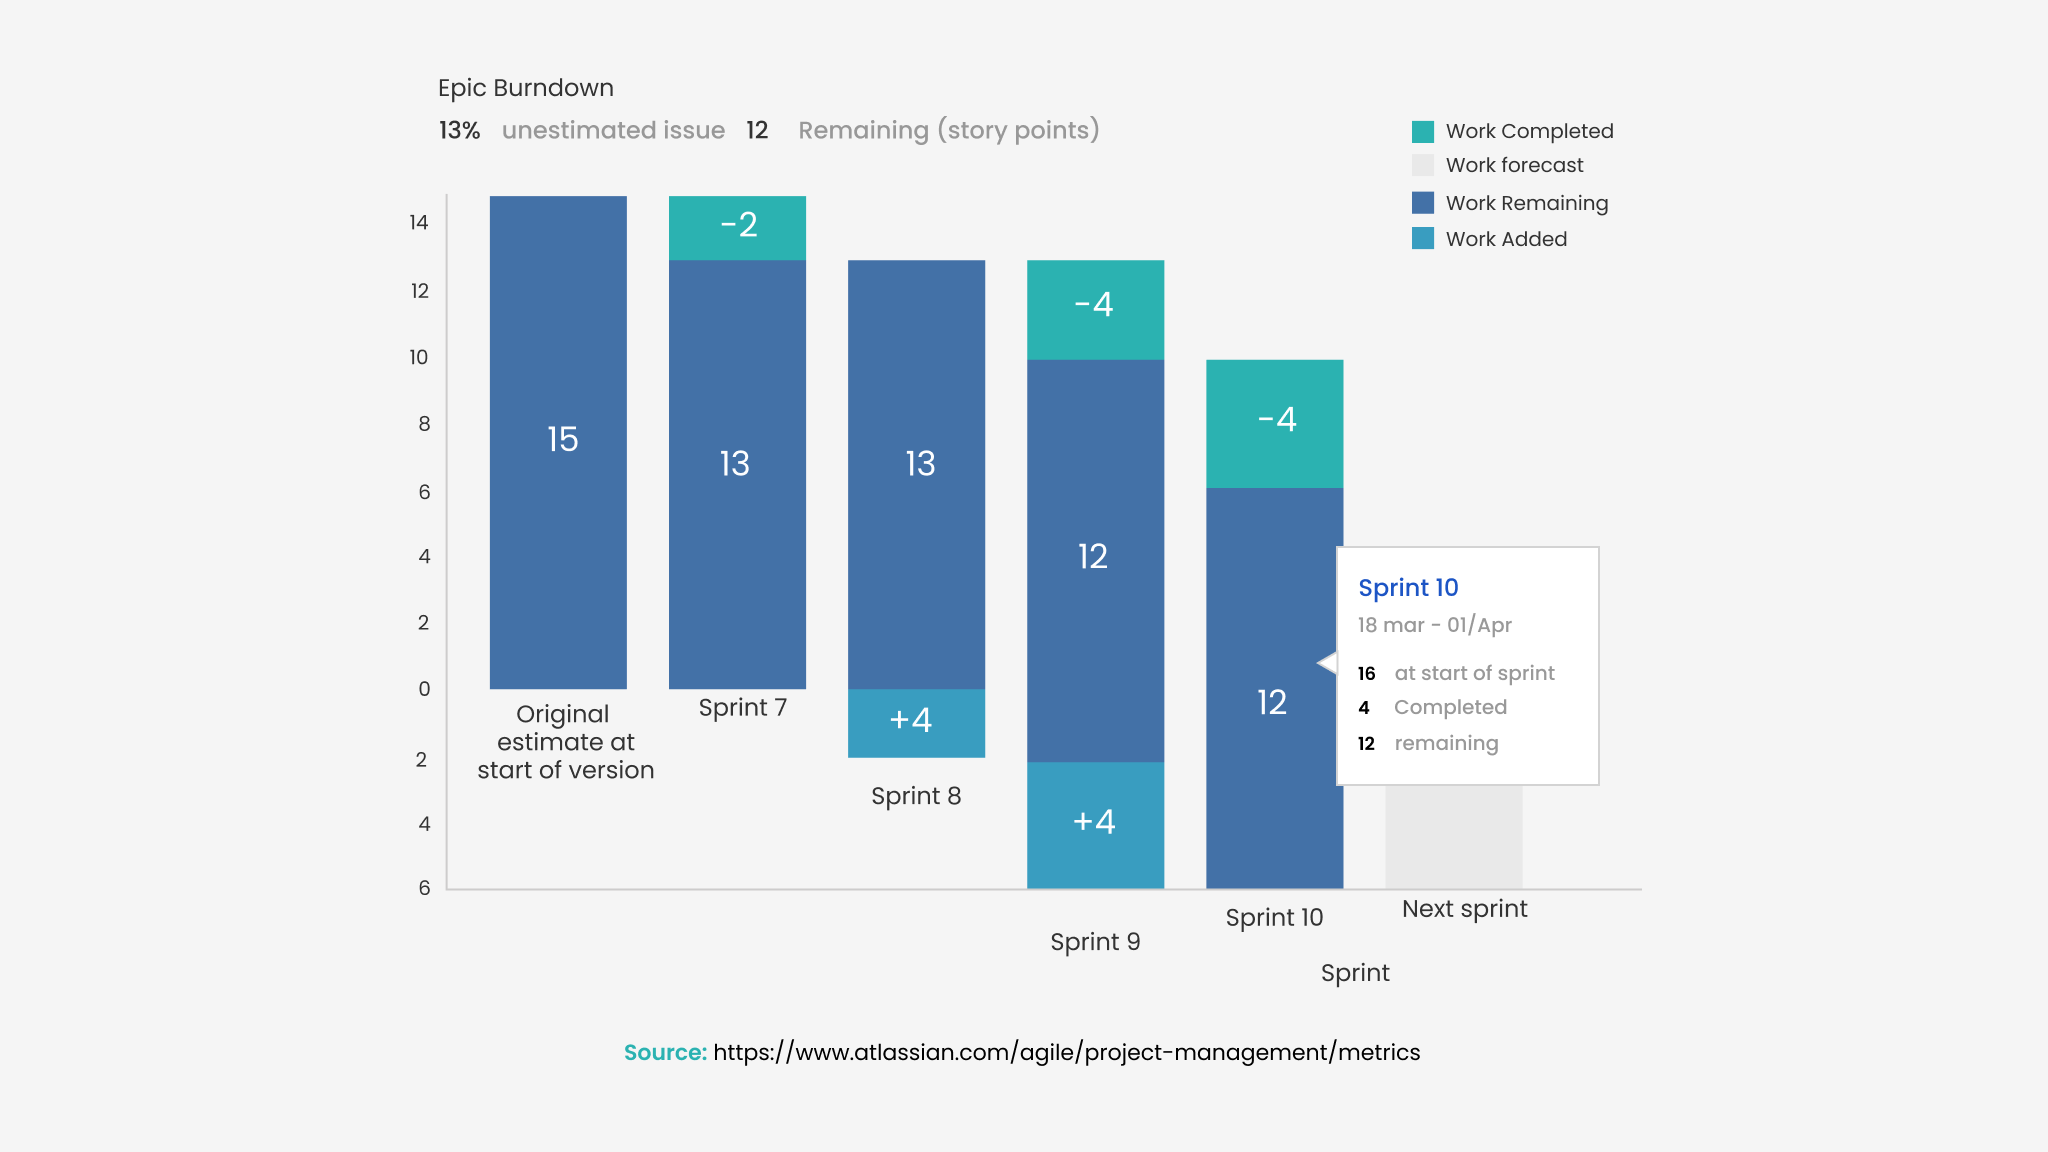
What to Look for When Aiming to Measure Epic and Release Burndown?
Keep an eye on any sudden increases in the remaining work within the Epic or Release. These spikes can be indicative of unplanned work items, such as critical defects or new feature requests. Distinguish between work related to addressing technical debt and work on planned user stories or features. This can be done by categorizing tasks or user stories as tech debt-related or feature-related.
3. Quality Metrics
Quality metrics is another vital and fundamental aspect of measurement for Agile development, that focuses on delivering work that meets the desired standards. It includes several factors that impact the overall outcome and satisfy the end-user. It can be categorized into following parts:
a. Cost of Quality
Cost of quality is the value of testing software. It includes:
- Prevention Cost: Training developers, reviewing code to prevent defects.
- Detection Cost: Cost of quality team including writing test cases, testing, filing defects etc
- Correction Cost: Cost to fix bugs by the team before release.
- Repair Cost: Cost to fix and manage escaped bugs. This also includes any damage control measures taken.
b. Escaped Bugs
These are defects that make it to the production environment and can be prevented with continuous and enhanced testing practices, thorough reviews, and detecting risks at an earlier stage.
c. Time to Fix Bugs in Production
The metric measures how quickly defects are addressed once they are discovered in the production environment. Necessary measures must be taken to speed up and find the production defects and address them. While having streamlined communication, involving the right experts can be of immense help.
What to Look for When Aiming to Accurately Measure Quality Metrics?
Increase in Cost of Quality
An unexplained increase in the cost of quality could be because of poor coding practices, lack of testing automation and CI/CD practices.
- Poor Coding Practices: It could suggest that developers are producing code with a higher defect rate, due to lack of coding standards, code reviews, or insufficient skills.
- Poor Quality of Manual Testing: This could be due to poor coverage of testing, time to test due to a lot of manual steps etc.
- Lack of Automation in Testing and CI/CD Practices: If the quality metrics reveal a lack of automation in testing and continuous integration/continuous delivery (CI/CD) practices, it can indicate inefficiencies and bottlenecks in the software delivery pipeline.
Escaped Bugs
A high number of escaped bugs can be indicative of several issues:
- Balance between Development and Quality: It may suggest an imbalance between development speed and quality assurance. A focus on speed might lead to insufficient testing and quality checks.
- Project Processes: Evaluate project processes, including code reviews, testing strategies, and regression testing. Escaped bugs can be mitigated through thorough reviews and automated regression testing
Time to Fix Bugs
If fixing bugs consistently requires a significant amount of time and effort, it signifies that the codebase has architectural flaws or lacks maintainability. Identifying root causes and addressing them is essential.
4. Overall Performance of Teams
When assessing the overall performance of teams, the focus is on evaluating how effectively the team is implementing DevOps practices and principles. It can further be categorized into DORA metrics, and we will delve into it below:
a. DORA Metrics
DORA metrics (DevOps Research and Assessment Team) are used by the DevOps team for measuring and assessing the performance of software development and delivery. It helps teams identify whether they are low performers or elite performers. DORA is a set of four measurements that include:
| Metric | Description |
| Deployment Frequency | Measures how often code changes are deployed to production, indicating release cadence. |
| Lead Time for Changes | Measures the time it takes for code changes to move from commit to deployment. |
| Mean Time to Recover | Measures how quickly a team can restore service after a production incident or failure. |
| Change Failure Rate | Measures the percentage of deployments causing failures or requiring immediate rollback. |
These metrics are often used in Agile and DevOps contexts to help teams identify bottlenecks, areas for improvement, and to track progress over time.
Cumulative flow diagram, code coverage, static code analysis, control chart are other key Agile practices that help teams measure their progress and grow. Overall, these Agile metrics play a vital role in boosting and enhancing the development process. Continuous monitoring and assessing these metrics guide towards right optimization and better outcomes for both the organizations and end-users.
What to Look for When Aiming to Accurately Measure DORA Metrics?
Regularly analyze the metrics, identify trends and patterns, and focus on areas that need improvement. Collaboration between development, operations, and other relevant teams is crucial to achieving DevOps success and leveraging these metrics effectively.
Effectively managing and improving development using metrics involves overcoming a range of general challenges related to tracking, setup, accuracy, and interpretation. By proactively addressing these challenges, development processes can be improved efficiently. Let us understand these challenges.
Challenges with Metrics
While the metrics mentioned above are important for assessing the quality and effectiveness of software development processes, they also come with their own set of challenges. Here are some challenges:
| Metric | Challenges and Considerations |
| Velocity | Story point weight can be subjective and prone to various manipulations. Therefore, velocity can vary widely between the teams.
The addition of new team members or changes in team composition impacts velocity, which makes it less stable as a long-term measure. |
| Cycle Time | Using cycle time in Agile may not capture the complete value or quality of work items, can be influenced by external factors and dependencies, or create unintended behaviors.
If there are any changes in scope mid-way, it can lead to incorrect cycle time, if changes are not documented properly. |
| Lead Time | Development often involves dependencies on other teams, tools, or processes. Delays in these dependencies, feedback, approvals, can impact lead time and make it difficult to assess the team’s efficiency. |
| Sprint Burndown | If the sprint backlog changes during the sprint, burndown chart will not be reflected accurately.
Charts are to be updated in real-time, if not it leads to misinformed decisions. |
| Epic and Burn-Down Charts | Dependencies between multiple epics or releases can impact the burndown, as delays in one area might affect the overall timeline. If all the work items are not apprehended in the burndown, it is not able to depict release or epic status. |
| Quality Metrics
|
Measuring quality requires metrics to be setup properly.
In addition to basic metrics, other factors should be measured like test cases, is essential for a comprehensive assessment of software quality. |
| DORA Metrics | DORA metrics might not cover all aspects of software development and delivery, potentially missing key factors unique to an organization leaving it with a limited scope.
To drive improvements in the metric may lead to taking shortcuts with testing causing buggy code. |
How can Agile Processes be More Effective?
Continuous improvement in Agile methodology is identifying the areas that need optimization and working with the team to bring out the ideas for an efficient workflow. Asking a series of questions, producing a plan, finding waste steps, and resolving, can help improve the Agile processes. Let us break down the statement further:
Define and Setup Metrics Properly in the Tool Used
Clearly define the objectives you want to achieve with your Agile processes. Metrics should align with these objectives. Choose metrics that are relevant to your goals and that can provide actionable insights. Common Agile metrics include velocity, lead time, cycle time, burn-up/burn-down charts and more.
Track Changes Regularly as Part of Retro and Regular Reviews
Retrospectives are dedicated meetings where the team reflects on what went well, what didn’t, and how to make improvements. Consistently tracking and understanding the root causes for changes through retrospectives and reviews, Agile teams can continuously adapt and optimize their processes, leading to more effective and efficient project outcome
Identify Delays and Drill Down
Regularly reviewing the sprint delay and drilling down into the reasons for those delays helps uncover the cause. This helps with an in-depth understanding of what went wrong and finding out if there are any common patterns for the cause.
Identifying the causes helps prevent similar delays from occurring in the future. Targeting the issues this way, developers can implement corrective actions and ensure a smoother workflow.
Finding and Eliminating Waste Steps
Agile methodologies like Scrum and Kanban focus on iterative development while delivering value to customers with incremental relationships. Therefore, it becomes vital to identify and eliminate the waste steps and further focus on activities that contribute to the desired project outcomes.
Process Improvement
Agile is all about continuous learning, adaptation, and optimization. Therefore, process improvement is one of the integral parts of the Agile mindset that brings more effectiveness to Agile practices. The sprint retrospectives offer dedicated time to the teams to know what all went well and what improvements can be made.
Automation
Automating the repetitive tasks in Agile including testing, deployment or other manual processes can eliminate the errors, cut-down cost and time while enhancing the overall efficiency. The team can therefore focus on more productive tasks that add value.
Developer Led Improvements
Developers are closest to the work and often have valuable insights into areas that can be optimized. Encouraging their input fosters a culture of ownership and continuous improvement.
Finding Rework Scenarios
It is vital to identify scenarios or cases that need reworking and fixing in time for the process improvement. Identifying the errors helps teams understand the root cause of the problem and solve it instantly, leading to more efficiency.
Improving Initial Steps
The initial steps like backlog, sprint planning, and defining user story are necessary that emerge as a cornerstone of success. Clear and well-defined requirements, priorities, and sprint goals lead to smoother execution and fewer surprises later in the process.
Clear and well-documented API (Application Programming Interfaces) specifications lead to better communication between teams, faster integration, and fewer misunderstandings
Epilogue
Agile is a blame-free process, so rather than finding errors in other’s work, the focus should be on identifying the loopholes in the process and improving. Even if there are issues with any of the team members, training can be provided that ensures all the team members have the necessary skills to succeed.
In the Agile landscape, sustainability is paramount. At FIRMINIQ, we recognize that continuous improvement and fostering a collaborative environment are the cornerstones of achieving enduring success. Each team member takes ownership of their work, actively collaborates with others, and holds themselves accountable for their contributions. For reference, have a look at one of our projects accomplished successfully.
Implementing Agile metrics, the right way ensures you get enough productivity, your development process is fast, you deliver quality and developers remain satisfied.
We have experienced scrum masters who take ownership and their guidance and support ensure that Agile practices are adhered to, roadblocks are removed, and the team remains aligned. If you wish to accomplish product development the right way using the best Agile practices reach out to us!
We would love to hear your feedback! Please let us know in the comments section below. We value your opinion and appreciate your time in sharing your thoughts.